
Resto
My approach with this challenge was to take the main categories and the data within those and repurpose them. I asked myself what types of things both doctors and patients alike would ideally like to see jump out at them about their EMRs. I came up with a few key points to address:
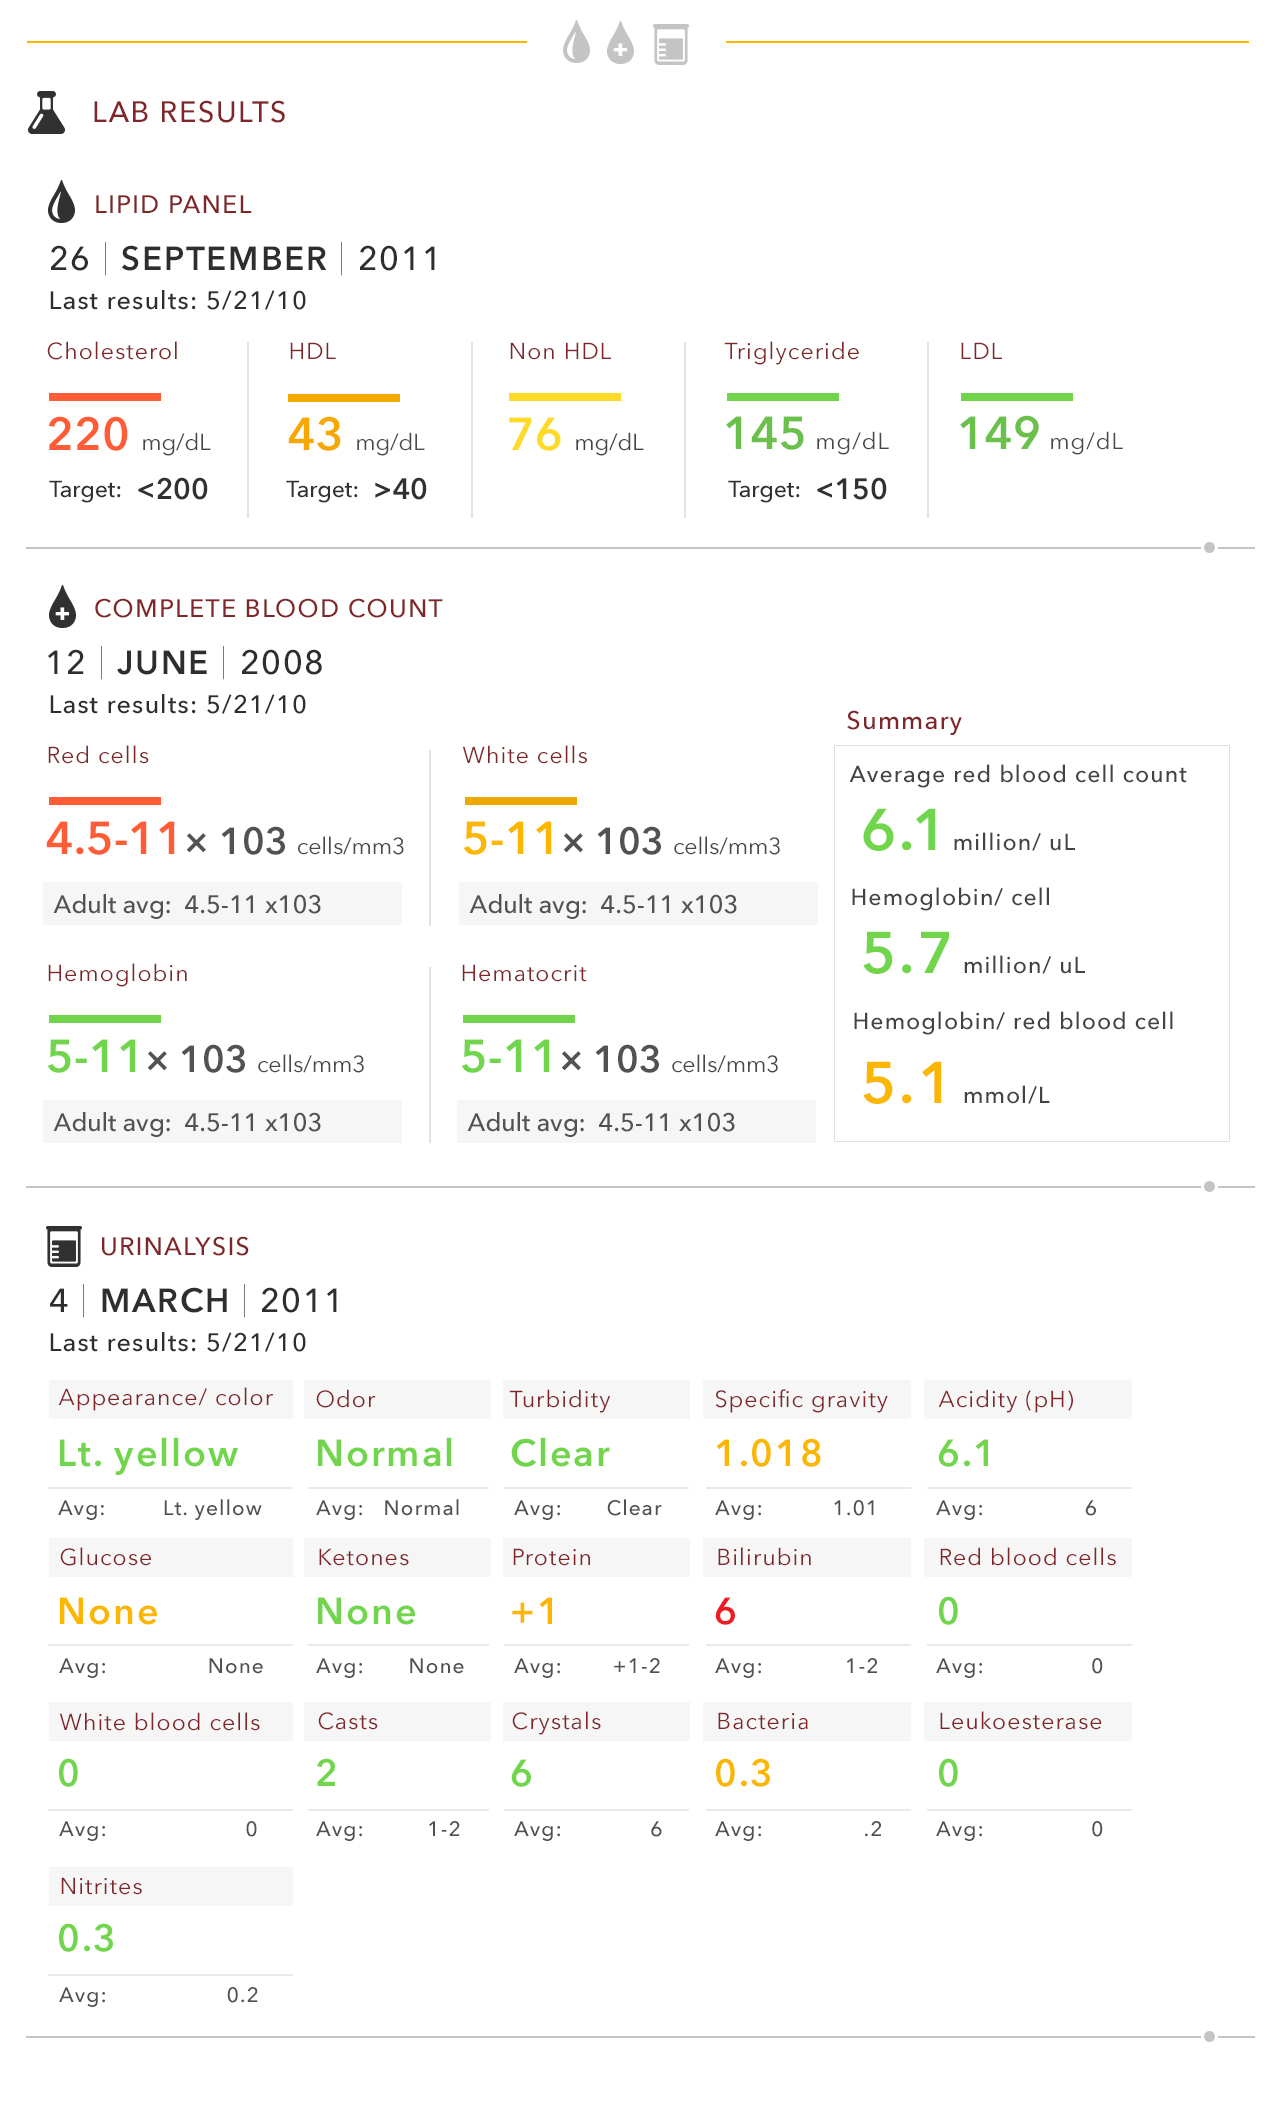
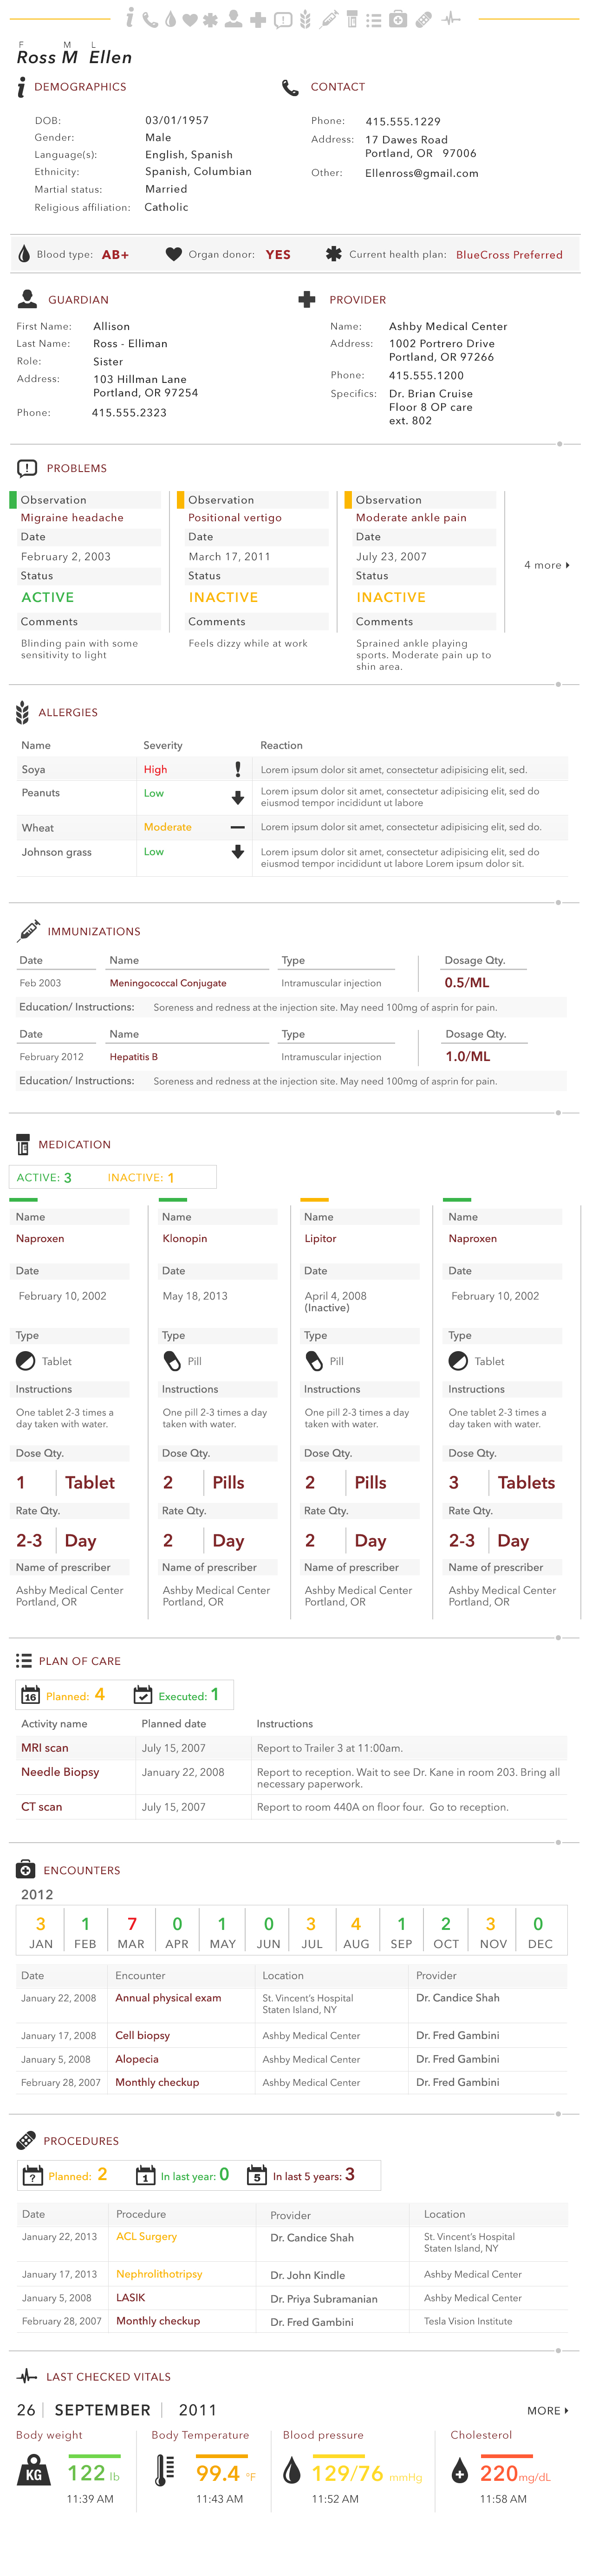
-I used icons to distinguish each section. This way people can get familiar with not just text, but relating each to a visual.
I also wanted to use color to help indicate the status of a given category's data. It also serves for severity of a given set. This helps viewers quickly scan for good and bad results and data.
For interactivity, each section can be closed and expanded using the small dots to the right of each separator per section. At the top, there is a universal nav with icons - when you roll over an icon it tells you which section it relates to , and upon click, it will take you down to that section. If there is more data than what i have listed, it can be populated vertically or horizontally using scrolling.
I also wanted a design that could be used as a static implementation- be it printed out, emailed, made into a pdf, etc.
Another item i thought was helpful when reading all of these results and data entries is having some kind of summary at the top of each section. This can be helpful if a patient has had 15+ medications, or 10 allergies in the past. This way patients and doctors alike can quickly see total numbers.
**There are a few things like 'past history' and 'average' numbers that i used in my design. Although i am not for certain that the EMRs have total access to all of this information, i designed it in there because i thought it would be very useful to have on hand, and , can help both patients and doctors do some quick calculations to gauge where they stand in their current health. This can be a future consideration, but i thought id include it now so we can see what is possible.
Thanks for looking!
1 comment
anthony barbato • over 13 years ago
i am realizing now that the main EMR may be too long, so please take a look at the attached pdf.
Thanks!