
EHR Dashboard
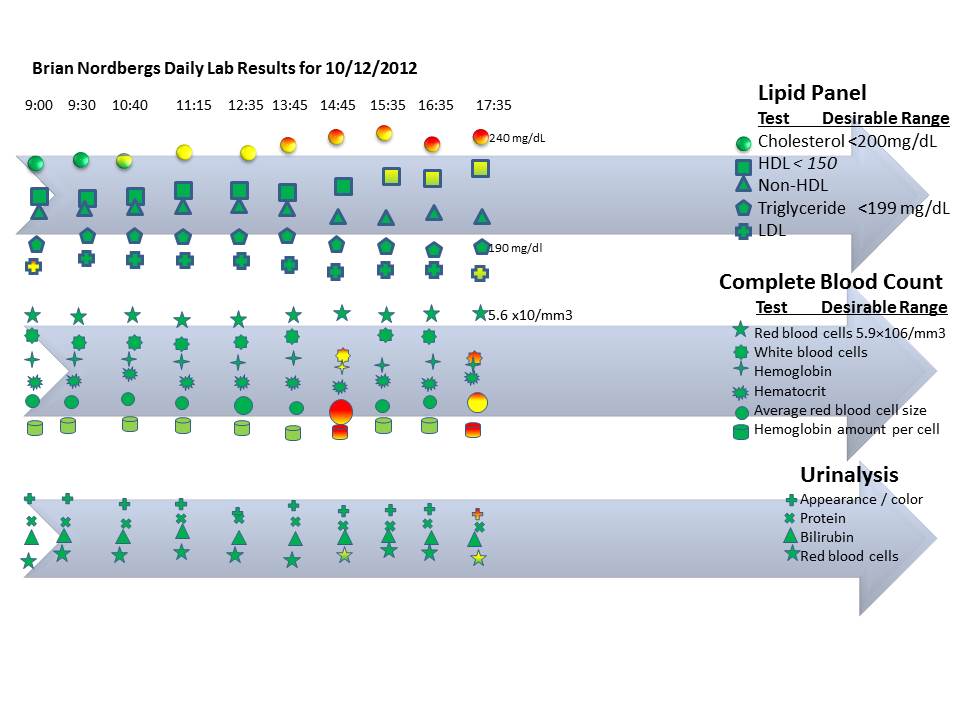
This view of the CCD is designed with the clinician and patient in mind. Lab values are displayed and color coded based on concepts of key performance indicators. Green images are values within range. Yellow indicates values starting to vary from normal and red values are our of range and should be evaluated. On hover over the images, actual lab values would be shown. The images would also be drillable such that further information of dates, times, locations and actual values would be displayed.
0 comments